RBS 2013 Annual Report Download - page 165
Download and view the complete annual report
Please find page 165 of the 2013 RBS annual report below. You can navigate through the pages in the report by either clicking on the pages listed below, or by using the keyword search tool below to find specific information within the annual report.-
 1
1 -
2
-
3
-
4
-
5
-
6
-
7
-
8
-
9
-
10
-
11
-
12
-
13
-
14
-
15
-
16
-
17
-
18
-
19
-
20
-
21
-
22
-
23
-
24
-
25
-
26
-
27
-
28
-
29
-
30
-
31
-
32
-
33
-
34
-
35
-
36
-
37
-
38
-
39
-
40
-
41
-
42
-
43
-
44
-
45
-
46
-
47
-
48
-
49
-
50
-
51
-
52
-
53
-
54
-
55
-
56
-
57
-
58
-
59
-
60
-
61
-
62
-
63
-
64
-
65
-
66
-
67
-
68
-
69
-
70
-
71
-
72
-
73
-
74
-
75
-
76
-
77
-
78
-
79
-
80
-
81
-
82
-
83
-
84
-
85
-
86
-
87
-
88
-
89
-
90
-
91
-
92
-
93
-
94
-
95
-
96
-
97
-
98
-
99
-
100
-
101
-
102
-
103
-
104
-
105
-
106
-
107
-
108
-
109
-
110
-
111
-
112
-
113
-
114
-
115
-
116
-
117
-
118
-
119
-
120
-
121
-
122
-
123
-
124
-
125
-
126
-
127
-
128
-
129
-
130
-
131
-
132
-
133
-
134
-
135
-
136
-
137
-
138
-
139
-
140
-
141
-
142
-
143
-
144
-
145
-
146
-
147
-
148
-
149
-
150
-
151
-
152
-
153
-
154
-
 155
155 -
 156
156 -
 157
157 -
 158
158 -
 159
159 -
 160
160 -
 161
161 -
 162
162 -
 163
163 -
 164
164 -
 165
165 -
 166
166 -
 167
167 -
 168
168 -
 169
169 -
 170
170 -
 171
171 -
 172
172 -
 173
173 -
 174
174 -
 175
175 -
176
-
177
-
178
-
179
-
180
-
181
-
182
-
183
-
184
-
185
-
186
-
187
-
188
-
189
-
190
-
191
-
192
-
193
-
194
-
195
-
196
-
197
-
198
-
199
-
200
-
201
-
202
-
203
-
204
-
205
-
206
-
207
-
208
-
209
-
210
-
211
-
212
-
213
-
214
-
215
-
216
-
217
-
218
-
219
-
220
-
221
-
222
-
223
-
224
-
225
-
226
-
227
-
228
-
229
-
230
-
231
-
232
-
233
-
234
-
235
-
236
-
237
-
238
-
239
-
240
-
241
-
242
-
243
-
244
-
245
-
246
-
247
-
248
-
249
-
250
-
251
-
252
-
253
-
254
-
255
-
256
-
257
-
258
-
259
-
260
-
261
-
262
-
263
-
264
-
265
-
266
-
267
-
268
-
269
-
270
-
271
-
272
-
273
-
274
-
275
-
276
-
277
-
278
-
279
-
280
-
281
-
282
-
283
-
284
-
285
-
286
-
287
-
288
-
289
-
290
-
291
-
292
-
293
-
294
-
295
-
296
-
297
-
298
-
299
-
300
-
301
-
302
-
303
-
304
-
305
-
306
-
307
-
308
-
309
-
310
-
311
-
312
-
313
-
314
-
315
-
316
-
317
-
318
-
319
-
320
-
321
-
322
-
323
-
324
-
325
-
326
-
327
-
328
-
329
-
330
-
331
-
332
-
333
-
334
-
335
-
336
-
337
-
338
-
339
-
340
-
341
-
342
-
343
-
344
-
345
-
346
-
347
-
348
-
349
-
350
-
351
-
352
-
353
-
354
-
355
-
356
-
357
-
358
-
359
-
360
-
361
-
362
-
363
-
364
-
365
-
366
-
367
-
368
-
369
-
370
-
371
-
372
-
373
-
374
-
375
-
376
-
377
-
378
-
379
-
380
-
381
-
382
-
383
-
384
-
385
-
386
-
387
-
388
-
389
-
390
-
391
-
392
-
393
-
394
-
395
-
396
-
397
-
398
-
399
-
400
-
401
-
402
-
403
-
404
-
405
-
406
-
407
-
408
-
409
-
410
-
411
-
412
-
413
-
414
-
415
-
416
-
417
-
418
-
419
-
420
-
421
-
422
-
423
-
424
-
425
-
426
-
427
-
428
-
429
-
430
-
431
-
432
-
433
-
434
-
435
-
436
-
437
-
438
-
439
-
440
-
441
-
442
-
443
-
444
-
445
-
446
-
447
-
448
-
449
-
450
-
451
-
452
-
453
-
454
-
455
-
456
-
457
-
458
-
459
-
460
-
461
-
462
-
463
-
464
-
465
-
466
-
467
-
468
-
469
-
470
-
471
-
472
-
473
-
474
-
475
-
476
-
477
-
478
-
479
-
480
-
481
-
482
-
483
-
484
-
485
-
486
-
487
-
488
-
489
-
490
-
491
-
492
-
493
-
494
-
495
-
496
-
497
-
498
-
499
-
500
-
501
-
502
-
503
-
504
-
505
-
506
-
507
-
508
-
509
-
510
-
511
-
512
-
513
-
514
-
515
-
516
-
517
-
518
-
519
-
520
-
521
-
522
-
523
-
524
-
525
-
526
-
527
-
528
-
529
-
530
-
531
-
532
-
533
-
534
-
535
-
536
-
537
-
538
-
539
-
540
-
541
-
542
-
543
-
544
-
545
-
546
-
547
-
548
-
549
-
550
-
551
-
552
-
553
-
554
-
555
-
556
-
557
-
558
-
559
-
560
-
561
-
562
-
563
-
564
 |
 |

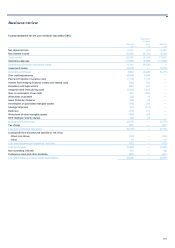
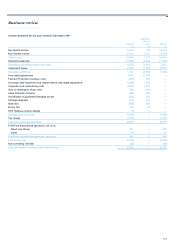
Business review
163
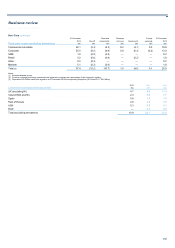
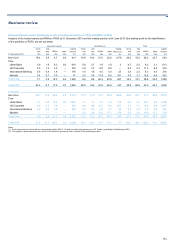
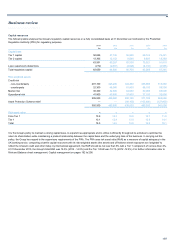
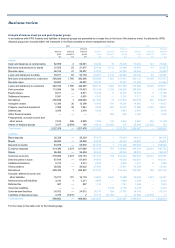
Estimated funded assets (third party assets excluding derivatives or TPA) and RWAe of RCR
Analysis of the funded assets and RWAe of RCR at 31 December 2013 and the related position at 30 June 2013 (the starting point for the identification
of the portfolios of RCR), are set out below.
Non-performing (1) Performing (1) Total
Gross Net Capital Gross Net Capital Gross Net Capital
TPA TPA RWAe RWA deducts TPA TPA RWAe RWA deducts (2) TPA TPA RWAe RWA deducts
31 December 2013 £bn £bn £bn £bn £m £bn £bn £bn £bn £m £bn £bn £bn £bn £m
Non-Core 18.4 5.8 4.7 0.5 413 10.8 10.4 21.5 23.2 (170) 29.2 16.2 26.2 23.7 243
Core
Ulster Bank 3.9 1.8 6.3 0.2 610 0.8 0.7 1.9 1.9 34.7 2.5 8.2 2.1 613
UK Corporate 2.3 1.6 3.5 — 353 3.9 3.7 8.0 8.0 —6.2 5.3 11.5 8.0 353
International Banking 0.5 0.4 1.8 — 178 1.9 1.8 4.5 4.3 23 2.4 2.2 6.3 4.3 201
Markets 0.4 0.1 0.9 — 91 2.6 2.6 11.9 8.6 331 3.0 2.7 12.8 8.6 422
Total Core 7.1 3.9 12.5 0.2 1,232 9.2 8.8 26.3 22.8 357 16.3 12.7 38.8 23.0 1,589
Total RCR 25.5 9.7 17.2 0.7 1,645 20.0 19.2 47.8 46.0 187 45.5 28.9 65.0 46.7 1,832
30 June 2013
Non-Core 22.3 11.8 39.4 2.2 3,716 17.9 17.9 31.6 38.4 (666) 40.2 29.7 71.0 40.6 3,050
Core
Ulster Bank 5.1 2.8 12.9 0.8 1,207 1.4 1.4 5.2 3.8 149 6.5 4.2 18.1 4.6 1,356
UK Corporate 2.9 2.5 7.9 — 762 4.6 4.6 12.3 9.6 265 7.5 7.1 19.9 9.6 1,027
International Banking 0.9 0.6 3.2 — 323 2.4 2.4 4.8 4.2 59 3.3 3.0 8.0 4.2 382
Markets — — — — — 2.8 2.8 19.8 17.1 270 2.8 2.8 19.8 17.1 270
Total Core 8.9 5.9 23.7 0.8 2,292 11.2 11.2 42.1 34.7 743 20.1 17.1 65.8 35.5 3,035
Total RCR 31.2 17.7 63.1 3.0 6,008 29.1 29.1 73.7 73.1 77 60.3 46.8 136.8 76.1 6,085
Notes
(1) Performing assets are those with an internal asset quality (AQ) of 1-9; and non-performing assets are in AQ 10 with a probability of default being 100%.
(2) The negative capital deductions are a result of the latent loss provisions held in respect of the performing portfolio.