RBS 2013 Annual Report Download - page 200
Download and view the complete annual report
Please find page 200 of the 2013 RBS annual report below. You can navigate through the pages in the report by either clicking on the pages listed below, or by using the keyword search tool below to find specific information within the annual report.-
 1
1 -
2
-
3
-
4
-
5
-
6
-
7
-
8
-
9
-
10
-
11
-
12
-
13
-
14
-
15
-
16
-
17
-
18
-
19
-
20
-
21
-
22
-
23
-
24
-
25
-
26
-
27
-
28
-
29
-
30
-
31
-
32
-
33
-
34
-
35
-
36
-
37
-
38
-
39
-
40
-
41
-
42
-
43
-
44
-
45
-
46
-
47
-
48
-
49
-
50
-
51
-
52
-
53
-
54
-
55
-
56
-
57
-
58
-
59
-
60
-
61
-
62
-
63
-
64
-
65
-
66
-
67
-
68
-
69
-
70
-
71
-
72
-
73
-
74
-
75
-
76
-
77
-
78
-
79
-
80
-
81
-
82
-
83
-
84
-
85
-
86
-
87
-
88
-
89
-
90
-
91
-
92
-
93
-
94
-
95
-
96
-
97
-
98
-
99
-
100
-
101
-
102
-
103
-
104
-
105
-
106
-
107
-
108
-
109
-
110
-
111
-
112
-
113
-
114
-
115
-
116
-
117
-
118
-
119
-
120
-
121
-
122
-
123
-
124
-
125
-
126
-
127
-
128
-
129
-
130
-
131
-
132
-
133
-
134
-
135
-
136
-
137
-
138
-
139
-
140
-
141
-
142
-
143
-
144
-
145
-
146
-
147
-
148
-
149
-
150
-
151
-
152
-
153
-
154
-
155
-
156
-
157
-
158
-
159
-
160
-
161
-
162
-
163
-
164
-
165
-
166
-
167
-
168
-
169
-
170
-
171
-
172
-
173
-
174
-
175
-
176
-
177
-
178
-
179
-
180
-
181
-
182
-
183
-
184
-
185
-
186
-
187
-
188
-
189
-
 190
190 -
 191
191 -
 192
192 -
 193
193 -
 194
194 -
 195
195 -
 196
196 -
 197
197 -
 198
198 -
 199
199 -
 200
200 -
 201
201 -
 202
202 -
 203
203 -
 204
204 -
 205
205 -
 206
206 -
 207
207 -
 208
208 -
 209
209 -
 210
210 -
211
-
212
-
213
-
214
-
215
-
216
-
217
-
218
-
219
-
220
-
221
-
222
-
223
-
224
-
225
-
226
-
227
-
228
-
229
-
230
-
231
-
232
-
233
-
234
-
235
-
236
-
237
-
238
-
239
-
240
-
241
-
242
-
243
-
244
-
245
-
246
-
247
-
248
-
249
-
250
-
251
-
252
-
253
-
254
-
255
-
256
-
257
-
258
-
259
-
260
-
261
-
262
-
263
-
264
-
265
-
266
-
267
-
268
-
269
-
270
-
271
-
272
-
273
-
274
-
275
-
276
-
277
-
278
-
279
-
280
-
281
-
282
-
283
-
284
-
285
-
286
-
287
-
288
-
289
-
290
-
291
-
292
-
293
-
294
-
295
-
296
-
297
-
298
-
299
-
300
-
301
-
302
-
303
-
304
-
305
-
306
-
307
-
308
-
309
-
310
-
311
-
312
-
313
-
314
-
315
-
316
-
317
-
318
-
319
-
320
-
321
-
322
-
323
-
324
-
325
-
326
-
327
-
328
-
329
-
330
-
331
-
332
-
333
-
334
-
335
-
336
-
337
-
338
-
339
-
340
-
341
-
342
-
343
-
344
-
345
-
346
-
347
-
348
-
349
-
350
-
351
-
352
-
353
-
354
-
355
-
356
-
357
-
358
-
359
-
360
-
361
-
362
-
363
-
364
-
365
-
366
-
367
-
368
-
369
-
370
-
371
-
372
-
373
-
374
-
375
-
376
-
377
-
378
-
379
-
380
-
381
-
382
-
383
-
384
-
385
-
386
-
387
-
388
-
389
-
390
-
391
-
392
-
393
-
394
-
395
-
396
-
397
-
398
-
399
-
400
-
401
-
402
-
403
-
404
-
405
-
406
-
407
-
408
-
409
-
410
-
411
-
412
-
413
-
414
-
415
-
416
-
417
-
418
-
419
-
420
-
421
-
422
-
423
-
424
-
425
-
426
-
427
-
428
-
429
-
430
-
431
-
432
-
433
-
434
-
435
-
436
-
437
-
438
-
439
-
440
-
441
-
442
-
443
-
444
-
445
-
446
-
447
-
448
-
449
-
450
-
451
-
452
-
453
-
454
-
455
-
456
-
457
-
458
-
459
-
460
-
461
-
462
-
463
-
464
-
465
-
466
-
467
-
468
-
469
-
470
-
471
-
472
-
473
-
474
-
475
-
476
-
477
-
478
-
479
-
480
-
481
-
482
-
483
-
484
-
485
-
486
-
487
-
488
-
489
-
490
-
491
-
492
-
493
-
494
-
495
-
496
-
497
-
498
-
499
-
500
-
501
-
502
-
503
-
504
-
505
-
506
-
507
-
508
-
509
-
510
-
511
-
512
-
513
-
514
-
515
-
516
-
517
-
518
-
519
-
520
-
521
-
522
-
523
-
524
-
525
-
526
-
527
-
528
-
529
-
530
-
531
-
532
-
533
-
534
-
535
-
536
-
537
-
538
-
539
-
540
-
541
-
542
-
543
-
544
-
545
-
546
-
547
-
548
-
549
-
550
-
551
-
552
-
553
-
554
-
555
-
556
-
557
-
558
-
559
-
560
-
561
-
562
-
563
-
564
 |
 |

Business review Risk and balance sheet management
198
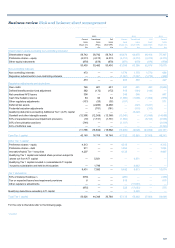
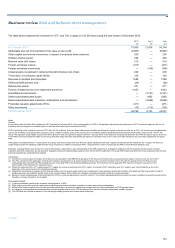
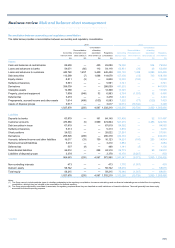
Capital management* continued
Capital resources continued
2013 2012 2011
Current Transitional Full Current Transitional Full Current
basis basis basis basis basis basis basis
(Basel 2.5) (PRA) (final CRR) (Basel 2.5) (draft CRR) (draft CRR) (Basel 2.5)
£m £m £m £m £m £m £m
Qualifying Tier 2 capital
Undated subordinated debt 2,109 — — 2,194 — — 1,838
Dated subordinated debt - net of amortisation 12,436 — — 13,420 — — 14,527
Qualifying items and related share premium —4,431 3,582 — 2,774 7,292 —
Qualifying own funds instruments issued by
subsidiaries and held by third parties —9,374 5,151 — 12,605 5,185 —
Unrealised gains on AFS equity shares 114 — — 63 — — 108
Collectively assessed impairment provisions 395 — — 399 399 399 635
Non-controlling Tier 2 capital — — — — — — 11
15,054 13,805 8,733 16,076 15,778 12,876 17,119
Tier 2 deductions
50% of securitisation positions (748) — — (1,107) — — (2,019)
50% of standardised expected losses less impairment provisions (25) — — (2,522) (3,077) — (3,451)
50% of material holdings (1) (976) — — (295) — — (340)
50% of APS first loss — — — — — — (2,763)
(1,749) — — (3,924) (3,077) — (8,573)
Total Tier 2 capital 13,305 13,805 8,733 12,152 12,701 12,876 8,546
Supervisory deductions
Unconsolidated investments
- Direct Line Group (1) — — — (2,081) — — (4,354)
- Other investments (36) — — (162) — — (239)
Other deductions (236) — — (244) — — (235)
(272) — — (2,487) — — (4,828)
Total regulatory capital 63,659 58,153 45,501 66,800 66,664 50,784 60,708
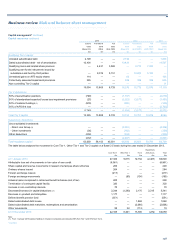
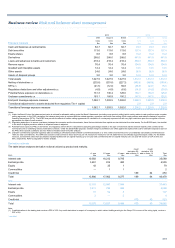
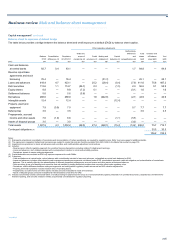
The table below analyses the movement in Core Tier 1, Other Tier 1 and Tier 2 capital on a Basel 2.5 basis during the year ended 31 December 2013.
Supervisory
Core Tier 1 Other Tier 1 Tier 2 deductions Total
£m £m £m £m £m
A
t 1 January 2013 47,320 9,815 12,152 (2,487) 66,800
A
ttributable loss net of movements in fair value of own credit (8,961) — — — (8,961)
Share capital and reserve movements in respect of employee share schemes 200 — — — 200
Ordinary shares issued 264 — — — 264
Foreign exchange reserve (217) — — — (217)
Foreign exchange movements — (93) (106) — (199)
A
ctuarial gains recognised in retirement benefit schemes (net of tax) 200 — — — 200
Termination of contingent capital facility 320 — — — 320
Increase in non-controlling interests 70 — — — 70
Decrease/(increase) in capital deductions (1) 2,244 (1,293) 2,175 2,215 5,341
Decrease in goodwill and intangibles 1,177 — — — 1,177
Defined benefit pension fund (551) — — — (551)
Dated subordinated debt issues — — 1,862 — 1,862
Dated subordinated debt maturities, redemptions and amortisation — — (2,666) — (2,666)
Other movements 99 32 (112) — 19
A
t 31 December 2013 42,165 8,461 13,305 (272) 63,659
Note:
(1) From 1 January 2013 material holdings in insurance companies are deducted 50% from Tier 1 and 50% from Tier 2.
*unaudited