RBS 2013 Annual Report Download - page 402
Download and view the complete annual report
Please find page 402 of the 2013 RBS annual report below. You can navigate through the pages in the report by either clicking on the pages listed below, or by using the keyword search tool below to find specific information within the annual report.-
 1
1 -
2
-
3
-
4
-
5
-
6
-
7
-
8
-
9
-
10
-
11
-
12
-
13
-
14
-
15
-
16
-
17
-
18
-
19
-
20
-
21
-
22
-
23
-
24
-
25
-
26
-
27
-
28
-
29
-
30
-
31
-
32
-
33
-
34
-
35
-
36
-
37
-
38
-
39
-
40
-
41
-
42
-
43
-
44
-
45
-
46
-
47
-
48
-
49
-
50
-
51
-
52
-
53
-
54
-
55
-
56
-
57
-
58
-
59
-
60
-
61
-
62
-
63
-
64
-
65
-
66
-
67
-
68
-
69
-
70
-
71
-
72
-
73
-
74
-
75
-
76
-
77
-
78
-
79
-
80
-
81
-
82
-
83
-
84
-
85
-
86
-
87
-
88
-
89
-
90
-
91
-
92
-
93
-
94
-
95
-
96
-
97
-
98
-
99
-
100
-
101
-
102
-
103
-
104
-
105
-
106
-
107
-
108
-
109
-
110
-
111
-
112
-
113
-
114
-
115
-
116
-
117
-
118
-
119
-
120
-
121
-
122
-
123
-
124
-
125
-
126
-
127
-
128
-
129
-
130
-
131
-
132
-
133
-
134
-
135
-
136
-
137
-
138
-
139
-
140
-
141
-
142
-
143
-
144
-
145
-
146
-
147
-
148
-
149
-
150
-
151
-
152
-
153
-
154
-
155
-
156
-
157
-
158
-
159
-
160
-
161
-
162
-
163
-
164
-
165
-
166
-
167
-
168
-
169
-
170
-
171
-
172
-
173
-
174
-
175
-
176
-
177
-
178
-
179
-
180
-
181
-
182
-
183
-
184
-
185
-
186
-
187
-
188
-
189
-
190
-
191
-
192
-
193
-
194
-
195
-
196
-
197
-
198
-
199
-
200
-
201
-
202
-
203
-
204
-
205
-
206
-
207
-
208
-
209
-
210
-
211
-
212
-
213
-
214
-
215
-
216
-
217
-
218
-
219
-
220
-
221
-
222
-
223
-
224
-
225
-
226
-
227
-
228
-
229
-
230
-
231
-
232
-
233
-
234
-
235
-
236
-
237
-
238
-
239
-
240
-
241
-
242
-
243
-
244
-
245
-
246
-
247
-
248
-
249
-
250
-
251
-
252
-
253
-
254
-
255
-
256
-
257
-
258
-
259
-
260
-
261
-
262
-
263
-
264
-
265
-
266
-
267
-
268
-
269
-
270
-
271
-
272
-
273
-
274
-
275
-
276
-
277
-
278
-
279
-
280
-
281
-
282
-
283
-
284
-
285
-
286
-
287
-
288
-
289
-
290
-
291
-
292
-
293
-
294
-
295
-
296
-
297
-
298
-
299
-
300
-
301
-
302
-
303
-
304
-
305
-
306
-
307
-
308
-
309
-
310
-
311
-
312
-
313
-
314
-
315
-
316
-
317
-
318
-
319
-
320
-
321
-
322
-
323
-
324
-
325
-
326
-
327
-
328
-
329
-
330
-
331
-
332
-
333
-
334
-
335
-
336
-
337
-
338
-
339
-
340
-
341
-
342
-
343
-
344
-
345
-
346
-
347
-
348
-
349
-
350
-
351
-
352
-
353
-
354
-
355
-
356
-
357
-
358
-
359
-
360
-
361
-
362
-
363
-
364
-
365
-
366
-
367
-
368
-
369
-
370
-
371
-
372
-
373
-
374
-
375
-
376
-
377
-
378
-
379
-
380
-
381
-
382
-
383
-
384
-
385
-
386
-
387
-
388
-
389
-
390
-
391
-
 392
392 -
 393
393 -
 394
394 -
 395
395 -
 396
396 -
 397
397 -
 398
398 -
 399
399 -
 400
400 -
 401
401 -
 402
402 -
 403
403 -
 404
404 -
 405
405 -
 406
406 -
 407
407 -
 408
408 -
 409
409 -
 410
410 -
 411
411 -
 412
412 -
413
-
414
-
415
-
416
-
417
-
418
-
419
-
420
-
421
-
422
-
423
-
424
-
425
-
426
-
427
-
428
-
429
-
430
-
431
-
432
-
433
-
434
-
435
-
436
-
437
-
438
-
439
-
440
-
441
-
442
-
443
-
444
-
445
-
446
-
447
-
448
-
449
-
450
-
451
-
452
-
453
-
454
-
455
-
456
-
457
-
458
-
459
-
460
-
461
-
462
-
463
-
464
-
465
-
466
-
467
-
468
-
469
-
470
-
471
-
472
-
473
-
474
-
475
-
476
-
477
-
478
-
479
-
480
-
481
-
482
-
483
-
484
-
485
-
486
-
487
-
488
-
489
-
490
-
491
-
492
-
493
-
494
-
495
-
496
-
497
-
498
-
499
-
500
-
501
-
502
-
503
-
504
-
505
-
506
-
507
-
508
-
509
-
510
-
511
-
512
-
513
-
514
-
515
-
516
-
517
-
518
-
519
-
520
-
521
-
522
-
523
-
524
-
525
-
526
-
527
-
528
-
529
-
530
-
531
-
532
-
533
-
534
-
535
-
536
-
537
-
538
-
539
-
540
-
541
-
542
-
543
-
544
-
545
-
546
-
547
-
548
-
549
-
550
-
551
-
552
-
553
-
554
-
555
-
556
-
557
-
558
-
559
-
560
-
561
-
562
-
563
-
564
 |
 |

Notes on the consolidated accounts
400
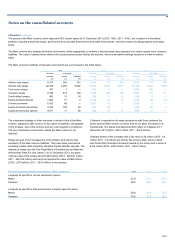
4 Pensions continued
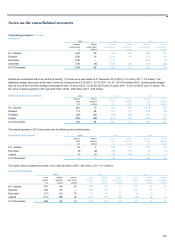
The assets of the Main scheme, which represent 85% of plan assets at 31 December 2013 (2012 - 85%; 2011 - 84%), are invested in a diversified
portfolio of quoted and private equity, government and corporate fixed-interest and index-linked bonds, and other assets including property and hedge
funds.
The Main scheme also employs derivative instruments, where appropriate, to achieve a desired asset class exposure or to match assets more closely to
liabilities. The value of assets shown reflects the actual physical assets held by the scheme, with any derivative holdings valued on a mark-to-market
basis.
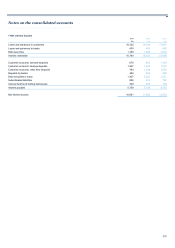
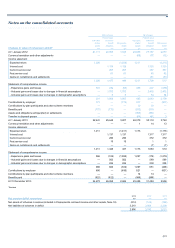
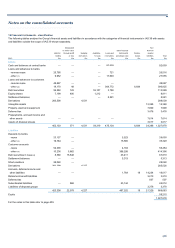
The Main scheme’s holdings of derivative instruments are summarised in the table below:
2013 2012 2011
Notional Fair value Notional Fair value Notional Fair value
amounts Assets Liabilities amounts Assets Liabilities amounts Assets Liabilities
£m £m £m £m £m £m £m £m £m
Inflation rate swaps 6,273 258 141 5,474 20 335 2,585 67 178
Interest rate swaps 22,108 3,283 2,867 19,304 3,424 2,811 15,149 2,232 1,864
Total return swaps 187 1 — 515 6 — 2,085 169 —
Currency swaps 2,196 813 720 2,539 326 259 2,861 116 117
Credit default swaps 900 13 16 709 11 12 238 6 —
Equity and bond futures 1,904 71 2 2,109 16 17 3,745 80 10
Currency forwards 9,182 66 — 8,551 41 — 2,078 8 —
Equity and bond call options 4,102 108 63 963 94 — 814 67 4
Equity and bond put options 4,071 11 90 963 13 31 665 11 —
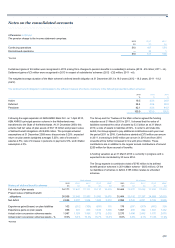
The investment strategy of other schemes is similar to that of the Main
scheme, adjusted to take account of the nature of liabilities, risk appetite
of the trustees, size of the scheme and any local regulatory constraints.
The use of derivative instruments outside the Main scheme is not
material.
Swaps are part of the management of the inflation and interest rate
sensitivity of the Main scheme liabilities. They have been executed at
prevailing market rates and within standard market bid/offer spreads. The
majority of swaps are with The Royal Bank of Scotland plc and National
Westminster Bank Plc (the “banks”). At 31 December 2013, the gross
notional value of the swaps was £31,664 million (2012 - £28,541 million;
2011 - £22,918 million) and had a net positive fair value of £624 million
(2012 - £370 million; 2011 - £431 million) to the scheme.
Collateral is required on all swap transactions with those between the
banks and the Main scheme on terms that do not allow the banks to re-
hypothecate. The banks had delivered £633 million of collateral at 31
December 2013 (2012 - £521 million; 2011 - £375 million).
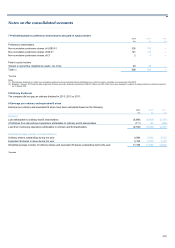
Ordinary shares of the company with a fair value of £4 million (2012 - £4
million; 2011 - £3 million) are held by the Group's Main scheme which
also holds other financial instruments issued by the Group with a value of
£416 million (2012 - £610 million; 2011 - £424 million).
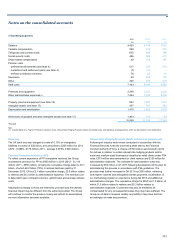
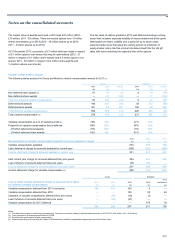
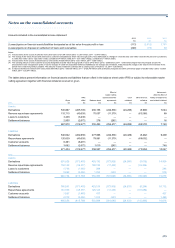
Post-retirement mortality assumptions (Main scheme) 2013 2012 2011
Longevity at age 60 for current pensioners (years)
Males 27.6 27.3 27.2
Females 29.5 29.2 29.1
Longevity at age 60 for future pensioners currently aged 40 (years)
Males 28.6 29.4 29.3
Females 30.8 31.0 30.9