RBS 2013 Annual Report Download - page 508
Download and view the complete annual report
Please find page 508 of the 2013 RBS annual report below. You can navigate through the pages in the report by either clicking on the pages listed below, or by using the keyword search tool below to find specific information within the annual report.-
 1
1 -
2
-
3
-
4
-
5
-
6
-
7
-
8
-
9
-
10
-
11
-
12
-
13
-
14
-
15
-
16
-
17
-
18
-
19
-
20
-
21
-
22
-
23
-
24
-
25
-
26
-
27
-
28
-
29
-
30
-
31
-
32
-
33
-
34
-
35
-
36
-
37
-
38
-
39
-
40
-
41
-
42
-
43
-
44
-
45
-
46
-
47
-
48
-
49
-
50
-
51
-
52
-
53
-
54
-
55
-
56
-
57
-
58
-
59
-
60
-
61
-
62
-
63
-
64
-
65
-
66
-
67
-
68
-
69
-
70
-
71
-
72
-
73
-
74
-
75
-
76
-
77
-
78
-
79
-
80
-
81
-
82
-
83
-
84
-
85
-
86
-
87
-
88
-
89
-
90
-
91
-
92
-
93
-
94
-
95
-
96
-
97
-
98
-
99
-
100
-
101
-
102
-
103
-
104
-
105
-
106
-
107
-
108
-
109
-
110
-
111
-
112
-
113
-
114
-
115
-
116
-
117
-
118
-
119
-
120
-
121
-
122
-
123
-
124
-
125
-
126
-
127
-
128
-
129
-
130
-
131
-
132
-
133
-
134
-
135
-
136
-
137
-
138
-
139
-
140
-
141
-
142
-
143
-
144
-
145
-
146
-
147
-
148
-
149
-
150
-
151
-
152
-
153
-
154
-
155
-
156
-
157
-
158
-
159
-
160
-
161
-
162
-
163
-
164
-
165
-
166
-
167
-
168
-
169
-
170
-
171
-
172
-
173
-
174
-
175
-
176
-
177
-
178
-
179
-
180
-
181
-
182
-
183
-
184
-
185
-
186
-
187
-
188
-
189
-
190
-
191
-
192
-
193
-
194
-
195
-
196
-
197
-
198
-
199
-
200
-
201
-
202
-
203
-
204
-
205
-
206
-
207
-
208
-
209
-
210
-
211
-
212
-
213
-
214
-
215
-
216
-
217
-
218
-
219
-
220
-
221
-
222
-
223
-
224
-
225
-
226
-
227
-
228
-
229
-
230
-
231
-
232
-
233
-
234
-
235
-
236
-
237
-
238
-
239
-
240
-
241
-
242
-
243
-
244
-
245
-
246
-
247
-
248
-
249
-
250
-
251
-
252
-
253
-
254
-
255
-
256
-
257
-
258
-
259
-
260
-
261
-
262
-
263
-
264
-
265
-
266
-
267
-
268
-
269
-
270
-
271
-
272
-
273
-
274
-
275
-
276
-
277
-
278
-
279
-
280
-
281
-
282
-
283
-
284
-
285
-
286
-
287
-
288
-
289
-
290
-
291
-
292
-
293
-
294
-
295
-
296
-
297
-
298
-
299
-
300
-
301
-
302
-
303
-
304
-
305
-
306
-
307
-
308
-
309
-
310
-
311
-
312
-
313
-
314
-
315
-
316
-
317
-
318
-
319
-
320
-
321
-
322
-
323
-
324
-
325
-
326
-
327
-
328
-
329
-
330
-
331
-
332
-
333
-
334
-
335
-
336
-
337
-
338
-
339
-
340
-
341
-
342
-
343
-
344
-
345
-
346
-
347
-
348
-
349
-
350
-
351
-
352
-
353
-
354
-
355
-
356
-
357
-
358
-
359
-
360
-
361
-
362
-
363
-
364
-
365
-
366
-
367
-
368
-
369
-
370
-
371
-
372
-
373
-
374
-
375
-
376
-
377
-
378
-
379
-
380
-
381
-
382
-
383
-
384
-
385
-
386
-
387
-
388
-
389
-
390
-
391
-
392
-
393
-
394
-
395
-
396
-
397
-
398
-
399
-
400
-
401
-
402
-
403
-
404
-
405
-
406
-
407
-
408
-
409
-
410
-
411
-
412
-
413
-
414
-
415
-
416
-
417
-
418
-
419
-
420
-
421
-
422
-
423
-
424
-
425
-
426
-
427
-
428
-
429
-
430
-
431
-
432
-
433
-
434
-
435
-
436
-
437
-
438
-
439
-
440
-
441
-
442
-
443
-
444
-
445
-
446
-
447
-
448
-
449
-
450
-
451
-
452
-
453
-
454
-
455
-
456
-
457
-
458
-
459
-
460
-
461
-
462
-
463
-
464
-
465
-
466
-
467
-
468
-
469
-
470
-
471
-
472
-
473
-
474
-
475
-
476
-
477
-
478
-
479
-
480
-
481
-
482
-
483
-
484
-
485
-
486
-
487
-
488
-
489
-
490
-
491
-
492
-
493
-
494
-
495
-
496
-
497
-
 498
498 -
 499
499 -
 500
500 -
 501
501 -
 502
502 -
 503
503 -
 504
504 -
 505
505 -
 506
506 -
 507
507 -
 508
508 -
 509
509 -
 510
510 -
 511
511 -
 512
512 -
 513
513 -
 514
514 -
 515
515 -
 516
516 -
 517
517 -
 518
518 -
519
-
520
-
521
-
522
-
523
-
524
-
525
-
526
-
527
-
528
-
529
-
530
-
531
-
532
-
533
-
534
-
535
-
536
-
537
-
538
-
539
-
540
-
541
-
542
-
543
-
544
-
545
-
546
-
547
-
548
-
549
-
550
-
551
-
552
-
553
-
554
-
555
-
556
-
557
-
558
-
559
-
560
-
561
-
562
-
563
-
564
 |
 |

Parent company financial statements and notes
506
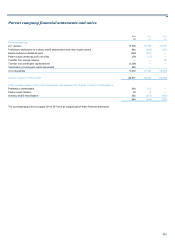
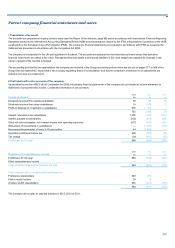
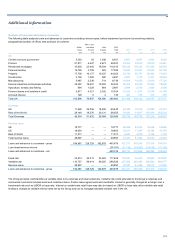
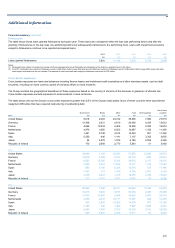
10 Subordinated liabilities
2013 2012 2011
£m £m £m
Dated loan capital 8,797 7,590 6,459
Undated loan capital 2,878 2,946 1,516
Preference shares 751 769 802
12,426 11,305 8,777
Certain preference shares issued by the company are classified as liabilities; these securities remain subject to the capital maintenance rules of the
Companies Act 2006.
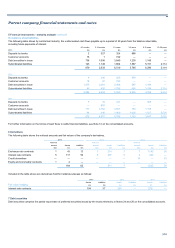
Currently 2014 2015 2016-2018 2019-2023 Thereafter Perpetual Total
2013 £m £m £m £m £m £m £m £m
- final redemption — 700 408 211 3,112 4,393 3,602 12,426
- call date 2,743 1,941 408 1,027 3,194 861 2,252 12,426
Currently 2013 2014 2015-2017 2018-2022 Thereafter Perpetual Total
2012 £m £m £m £m £m £m £m £m
- final redemption — 647 618 417 1,601 4,420 3,602 11,305
- call date 767 2,257 1,822 1,225 1,601 1,514 2,119 11,305
Currently 2012 2013 2014-2016 2017-2021 Thereafter Perpetual Total
2011 £m £m £m £m £m £m £m £m
- final redemption — 121 484 1,079 226 4,570 2,297 8,777
- call date 870 1,165 1,032 2,754 626 1,389 941 8,777
11 Share capital
Details of the company’s share capital are set out in Note 26 on the consolidated accounts.
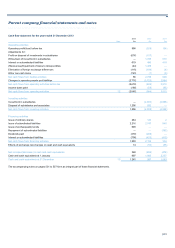
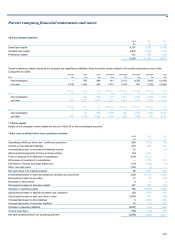
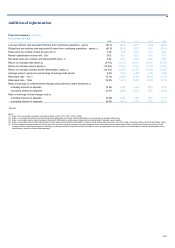
12 Net cash (outflow)/inflow from operating activities
2013 2012 2011
£m £m £m
Operating profit/(loss) before tax - continuing operations 998 (529) (34)
Interest on subordinated liabilities 619 486 419
Increase/(decrease) in accruals and deferred income 22 — (5)
(Recoveries)/impairments of loans to Group entities (44) 1,409 —
Profit on disposal of investments in subsidiaries (676) (157) —
Write-down of investment in subsidiaries — 1,785 570
Elimination of foreign exchange differences (118) (194) (4)
Other non-cash items (745) (1) —
Net cash inflow from trading activities 56 2,799 946
(Increase)/decrease in loans and advances to banks and customers (225) (4,737) 3,596
Decrease/(increase) in securities 31 46 (114)
Decrease in other assets 9 4 5
Decrease/(increase) in derivative assets 347 991 (27)
Changes in operating assets 162 (3,696) 3,460
(Decrease)/increase in deposits by banks and customers (63) (585) 328
(Decrease)/increase in debt securities in issue (2,895) 937 (369)
Increase/(decrease) in other liabilities 6 (309) (303)
Increase/(decrease) in derivative liabilities 55 (72) (152)
Changes in operating liabilities (2,897) (29) (496)
Income taxes paid (186) (58) (95)
Net cash (outflow)/inflow from operating activities (2,865) (984) 3,815