RBS 2013 Annual Report Download - page 154
Download and view the complete annual report
Please find page 154 of the 2013 RBS annual report below. You can navigate through the pages in the report by either clicking on the pages listed below, or by using the keyword search tool below to find specific information within the annual report.-
 1
1 -
2
-
3
-
4
-
5
-
6
-
7
-
8
-
9
-
10
-
11
-
12
-
13
-
14
-
15
-
16
-
17
-
18
-
19
-
20
-
21
-
22
-
23
-
24
-
25
-
26
-
27
-
28
-
29
-
30
-
31
-
32
-
33
-
34
-
35
-
36
-
37
-
38
-
39
-
40
-
41
-
42
-
43
-
44
-
45
-
46
-
47
-
48
-
49
-
50
-
51
-
52
-
53
-
54
-
55
-
56
-
57
-
58
-
59
-
60
-
61
-
62
-
63
-
64
-
65
-
66
-
67
-
68
-
69
-
70
-
71
-
72
-
73
-
74
-
75
-
76
-
77
-
78
-
79
-
80
-
81
-
82
-
83
-
84
-
85
-
86
-
87
-
88
-
89
-
90
-
91
-
92
-
93
-
94
-
95
-
96
-
97
-
98
-
99
-
100
-
101
-
102
-
103
-
104
-
105
-
106
-
107
-
108
-
109
-
110
-
111
-
112
-
113
-
114
-
115
-
116
-
117
-
118
-
119
-
120
-
121
-
122
-
123
-
124
-
125
-
126
-
127
-
128
-
129
-
130
-
131
-
132
-
133
-
134
-
135
-
136
-
137
-
138
-
139
-
140
-
141
-
142
-
143
-
 144
144 -
 145
145 -
 146
146 -
 147
147 -
 148
148 -
 149
149 -
 150
150 -
 151
151 -
 152
152 -
 153
153 -
 154
154 -
 155
155 -
 156
156 -
 157
157 -
 158
158 -
 159
159 -
 160
160 -
 161
161 -
 162
162 -
 163
163 -
 164
164 -
165
-
166
-
167
-
168
-
169
-
170
-
171
-
172
-
173
-
174
-
175
-
176
-
177
-
178
-
179
-
180
-
181
-
182
-
183
-
184
-
185
-
186
-
187
-
188
-
189
-
190
-
191
-
192
-
193
-
194
-
195
-
196
-
197
-
198
-
199
-
200
-
201
-
202
-
203
-
204
-
205
-
206
-
207
-
208
-
209
-
210
-
211
-
212
-
213
-
214
-
215
-
216
-
217
-
218
-
219
-
220
-
221
-
222
-
223
-
224
-
225
-
226
-
227
-
228
-
229
-
230
-
231
-
232
-
233
-
234
-
235
-
236
-
237
-
238
-
239
-
240
-
241
-
242
-
243
-
244
-
245
-
246
-
247
-
248
-
249
-
250
-
251
-
252
-
253
-
254
-
255
-
256
-
257
-
258
-
259
-
260
-
261
-
262
-
263
-
264
-
265
-
266
-
267
-
268
-
269
-
270
-
271
-
272
-
273
-
274
-
275
-
276
-
277
-
278
-
279
-
280
-
281
-
282
-
283
-
284
-
285
-
286
-
287
-
288
-
289
-
290
-
291
-
292
-
293
-
294
-
295
-
296
-
297
-
298
-
299
-
300
-
301
-
302
-
303
-
304
-
305
-
306
-
307
-
308
-
309
-
310
-
311
-
312
-
313
-
314
-
315
-
316
-
317
-
318
-
319
-
320
-
321
-
322
-
323
-
324
-
325
-
326
-
327
-
328
-
329
-
330
-
331
-
332
-
333
-
334
-
335
-
336
-
337
-
338
-
339
-
340
-
341
-
342
-
343
-
344
-
345
-
346
-
347
-
348
-
349
-
350
-
351
-
352
-
353
-
354
-
355
-
356
-
357
-
358
-
359
-
360
-
361
-
362
-
363
-
364
-
365
-
366
-
367
-
368
-
369
-
370
-
371
-
372
-
373
-
374
-
375
-
376
-
377
-
378
-
379
-
380
-
381
-
382
-
383
-
384
-
385
-
386
-
387
-
388
-
389
-
390
-
391
-
392
-
393
-
394
-
395
-
396
-
397
-
398
-
399
-
400
-
401
-
402
-
403
-
404
-
405
-
406
-
407
-
408
-
409
-
410
-
411
-
412
-
413
-
414
-
415
-
416
-
417
-
418
-
419
-
420
-
421
-
422
-
423
-
424
-
425
-
426
-
427
-
428
-
429
-
430
-
431
-
432
-
433
-
434
-
435
-
436
-
437
-
438
-
439
-
440
-
441
-
442
-
443
-
444
-
445
-
446
-
447
-
448
-
449
-
450
-
451
-
452
-
453
-
454
-
455
-
456
-
457
-
458
-
459
-
460
-
461
-
462
-
463
-
464
-
465
-
466
-
467
-
468
-
469
-
470
-
471
-
472
-
473
-
474
-
475
-
476
-
477
-
478
-
479
-
480
-
481
-
482
-
483
-
484
-
485
-
486
-
487
-
488
-
489
-
490
-
491
-
492
-
493
-
494
-
495
-
496
-
497
-
498
-
499
-
500
-
501
-
502
-
503
-
504
-
505
-
506
-
507
-
508
-
509
-
510
-
511
-
512
-
513
-
514
-
515
-
516
-
517
-
518
-
519
-
520
-
521
-
522
-
523
-
524
-
525
-
526
-
527
-
528
-
529
-
530
-
531
-
532
-
533
-
534
-
535
-
536
-
537
-
538
-
539
-
540
-
541
-
542
-
543
-
544
-
545
-
546
-
547
-
548
-
549
-
550
-
551
-
552
-
553
-
554
-
555
-
556
-
557
-
558
-
559
-
560
-
561
-
562
-
563
-
564
 |
 |

Business review
152
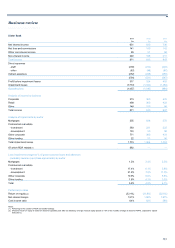
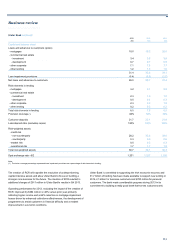
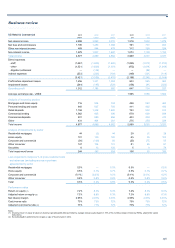
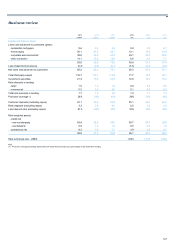
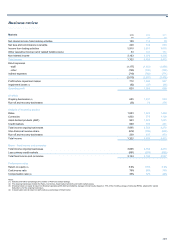
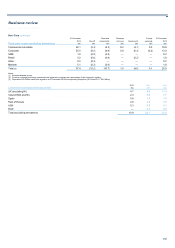
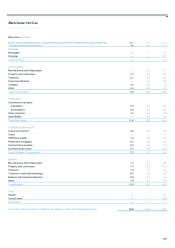
Markets continued
In 2013, Markets launched and executed a strategic repositioning of the
business, aimed at reducing risk, tightening controls, consolidating the
geographic footprint and reducing complexity by refocusing on the
franchise’s core strengths in fixed income products. The division met or
exceeded all internal targets for reducing controllable costs, risk weighted
assets and balance sheet, while meeting revenue and operating profit
expectations. Controls were enhanced, trading was integrated into four
financial hubs, the front-to-back operating model was simplified and an
agreement was reached for the sale of the Investor Products and Equity
Derivatives business. Market share in the four core product areas (Rates,
Currencies, Asset Backed Products and Credit) remained broadly stable
with high profile client transactions executed across the globe. As a result
of the strategic repositioning, Markets ended 2013 better positioned for
the changing regulatory and external environment.
Lower income in 2013 compared with 2012 reflected both the strategic
scaling back of the balance sheet and risk reduction in a difficult market
environment. Client activity was limited by the uncertainty that
surrounded the much anticipated tapering of the Federal Reserve’s
programme of quantitative easing. This contrasted with 2012 when
markets were boosted by the European Central Bank’s Long Term
Refinancing Operation. Nevertheless, Markets’ core businesses
remained resilient and continued to produce positive results. Currencies
income increased significantly year on year and Corporate Debt Capital
Markets reaffirmed its leading position in the GBP market.
2013 compared with 2012
Operating profit fell by £889 million with income falling by 26%, partly
offset by significant cost reductions. The de-risking of Markets resulted in
a 36% reduction in risk-weighted assets.
Rates actively repositioned the business during 2013, lowering the
balance sheet and reducing risk. This, combined with a weak trading
performance in H1 2013, resulted in subdued returns.
Currencies income increased as the franchise remained resilient and FX
Options benefited from opportunities in volatile FX and emerging
markets.
Asset Backed Products continued to perform well, although income was
affected by investor concerns regarding tapering of the Federal Reserve’s
programme of quantitative easing and a reduction in the balance sheet
and risk resources deployed by the business.
Credit Markets reflected the previous year’s de-risking of credit trading
and witnessed a modest reduction in Debt Capital Markets income,
although the business executed a number of significant transactions and
retained its leading position in corporate GBP issuance.
Costs fell by 11%, reflecting a reduction in headcount of 1,000 – split
evenly between the front and back-office - and tightly controlled
discretionary expenses, although this was offset by a higher level of legal
costs, primarily related to legacy issues in the US Asset Backed Products
business.
The increase in impairments was driven predominantly by provisions
against a single exposure in 2013.
Reducing risk and refocusing the division on core fixed income and
currencies products drove a substantial reduction in both balance sheet
and risk capital. Third party assets were £72 billion lower than 31
December 2012 and risk-weighted assets, at £65 billion, were down £37
billion.
2012 compared with 2011
Operating profit increased by 68% reflecting 2% growth in income and
20% decrease in direct expenses, most notably through a reduction in
staff costs.
Rates benefited from a strong trading performance, while losses incurred
in managing counterparty exposures during the third quarter of 2011
were not repeated during 2012. Revenues for the year were up 32% to
£1.9 billion.
Currencies volumes were weak across the industry, although the Spot FX
business minimised the impact on revenue. Options income was limited
by further Eurozone uncertainty.
Asset Backed Products continued to perform strongly as markets were
sustained throughout the year by investors’ search for yield. Revenues
for the year were £1.3 billion, up 8% from a strong performance of £1.22
billion in 2011.
A 59% increase in Credit Markets revenue to £735 million was driven by
Flow Credit which, as a result of improved risk management and more
benign market conditions, recorded good profitability compared with a
loss in 2011. This was partially offset by weaker earnings from credit
origination.
The division focused on controlling costs throughout 2012, driving total
expenses down by 16%. Lower staff expenses, down 26%, reflect lower
headcount and lower levels of variable compensation, including
reductions and clawbacks following the Group’s LIBOR settlements
reached on 6 February 2013, with the compensation ratio falling from
44% to 32%. Headcount reductions totalled 2,700 in the year, including
that resulting from the exit of businesses announced in January. Other
expenses fell by 3% as rigorous controls on discretionary expenditure
and the exiting of product areas continued to take effect, partially offset
by higher legal expenses.
The reduction in third party assets reflected management action to
optimise and de-risk the balance sheet, consistent with previously
disclosed medium-term objectives.
The division reduced risk-weighted assets, successfully focusing on
lowering risk and enhancing models whilst managing the requirement for
greater prudence in the regulatory environment.
Not reflected in Markets operating results in 2012 were the following
items: £381 million for regulatory fines; £350 million for its share of the
provision for interest rate swap redress; and approximately £700 million
in restructuring costs associated with the strategic changes that took
place during 2012.